|
- MONUMENTAL CHANGES IN THE U.S. CAPITAL MARKET - DATED DECEMBER 2, 2003 A SPECIAL REPORT BY ALAN M. NEWMAN, EDITOR LONGBOAT GLOBAL ADVISORS CROSSCURRENTS MR. NEWMAN'S SPEECH "METAMORPHOSIS" WAS PRESENTED AT THE INTERNATIONAL FEDERATION OF TECHNICAL ANALYSTS (I.F.T.A.) CONFERENCE AT THE CAPITAL HILTON IN WASHINGTON, D.C., ON NOVEMBER 8, 2003. WHEN FIRST WRITTEN, THE SPEECH RAN OVER AN HOUR AND HAD TO BE PARED TO 35 MINUTES FOR THE FORMAT, WHICH ALSO ALLOWED A FEW MINUTES OF QUESTIONS. THE SUBJECT IS ONE THAT CAN BE EXAMINED EXHAUSTIVELY. THIS REPORT IS COMPRISED OF THE FINAL VERSION OF THE SPEECH AND HAS BEEN EXPANDED UPON ESPECIALLY FOR THIS UPDATE OF "PICTURES OF A STOCK MARKET MANIA." ALTHOUGH THE SPEECH WAS DESIGNED TO COMMENT UPON THE FUTURE OF TECHNICAL ANALYSIS, THERE IS A SUBSTANTIAL AMOUNT OF COMMENTARY WITHIN THAT AFFECTS ALL INVESTORS. |
| Perhaps the
most astonishing development of the last six years is not the scandals
that have surfaced and not even the routine acceptance of same by investors.
The passing of prior generations and the "sizzle" of new technology have
conspired to convince investors and speculators that the environment has
changed for the better, for the MUCH better and permanently so. However,
the market remains an arena where human frailties can cause the grossest
judgments to occur. It is not only the emotional response of the
mania that has brought us closer to a fall out from which we will not easily
recover - the circumstances are driven as well by mechanical factors such
as the U.S. stock market have never experienced before. When I was
invited to speak before the I.F.T.A., I immediately knew there was only
one direction in which my presentation could go, the metamorphosis
of the American stock market.
The nature of sentiment has changed significantly. The nature of investment has changed dramatically.
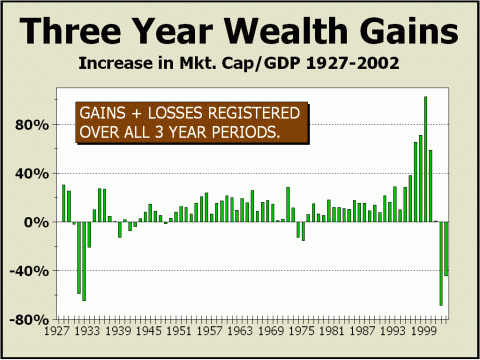
I was 8 years old when I heard about the Roaring Twenties for the first time. My Dad was a stockbroker in 1929 and he told me all the stories of the great rise in prices and the crash that followed. In 1930, the stock market suffered a staggering 51% loss in capitalization, an amount equal to 80% of the gross national product. And it changed the way Americans viewed the stock market for decades to come. Risk became a four letter word. My Dad did the only thing that made any sense. He placed all of his stock certificates in a safe deposit vault at National City Bank and forgot about them. Finally, in 1968, after receiving letters from asset tracers for at least 20 years, he caved in. After 39 years, he had to know what he had forgotten about. That is real fear. That is capitulation. My Father's experience was certainly not unique. An entire generation lost respect for the market and avoided risk. So, what was in the vault? I spent weeks at the Brooklyn Business Library, looking up corporate names in huge dusty Commerce Clearinghouse volumes. He had plenty of wallpaper to be sure, like Lawyer's Title & Guarantee, which went from 400 to zero. He had certificates of every kind and description, spin-offs, takeovers and even some real survivors. One set of certificates read Chase National Bank on the front and on the back, read, "Amerex Corp. attached share-for-share." If anyone thinks they have heard this story before, they have. It appeared in Nelson Demille's book Gold Coast a few years ago [ED NOTE: PAGE 42]. The story is true and originated with my Dad's experience. We finally found out why the asset tracers were trying to hunt him down for a 50% fee. Amerex was the forerunner of American Express and the company had no idea how to get in touch with him for the dividends that had accrued. So, he didn't have to pay the asset tracers a dime, but the happy ending came almost four decades later. The long term had bailed him out, but my father was then 69 years old. Over the 39 years he waited, the Dow gained an average of 2.6% per year. Dividends averaged 4.7%, a rather large difference from todayís stock market. Fast forward to the year 2003. Despite a veritable stock market mania, the subsequent collapse of Nasdaq and the eradication of more than 40% of total stock market capitalization, capitulation in the classic sense of the word was nowhere to be found. Newsletter writers never really gave up on the market. For a period of 190 weeks after the Dow peaked in January 2000, bears outnumbered bulls only nine times. Strategists continued to allocate 70% to stocks just as if a bull market had been in effect all along. And although mutual funds did briefly experience net outflows, they were tame by comparison to the fallout of both the 1972 and 1987 tops.
The nature of sentiment has changed significantly. Fear and capitulation are not what they used to be. After the crash in 1987, mutual fund outflows reached 11% of total fund assets. But we had a far worse and just as dramatic price collapse for Nasdaq after March 2000 and even a 50% collapse for the S&P 500, yet mutual outflows only reached 3.6% of total assets. In 2001, the loss in market cap was more than 31% of our GDP. Yet there were only three weeks in the entire year where bearish newsletter writers proliferated over bulls, strategists maintained high allocations to stocks and mutual fund inflows remained positive in seven months and were positive for the year. Looking at chart #1, one can easily see the impact of wealth losses after the 1929 crash - sufficient to generate the kind of fear and loathing experienced by my father and countless others like him. Incredibly, even with losses of the same magnitude following the collapse of Nasdaq in the current bubble, there was anything but fear and loathing for stocks. On July 30, 2001, at Dow 10,400, strategist's stock allocations were at 71%. Fourteen months later at Dow 8200, only two weeks from the bottom - strategists STILL had 70% allocations to stocks. A pattern has developed - a resistance to fear - much of which is based on purely mechanical factors - and as an effect - there is an artificial imbalance in demand. This is the linchpin of a metamorphosis of the financial markets - and the metamorphosis does not augur well for the future of the U.S. stock market, the world markets, or for Technical Analysis.
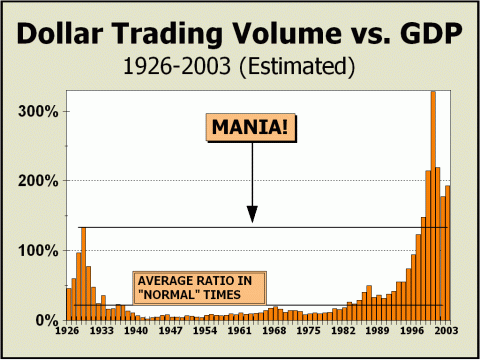
Stocks have become the biggest business in the world. NOTHING is bigger. When prices peaked in 2000, an average day witnessed the transaction of a little over $27 billion in Gross Domestic Product. On that same day, nearly $90 billion was transacted in stocks. For every dollar transacted in goods and services, $3.28 was transacted in stocks, two-and-a-half times what occurred at the peak in 1929. On one day in February 2001, Cisco Systems alone traded an amount nearly one-third of the value of all goods and services transacted that day. Some critics have complained that the much lower commission structures in place and even better research techniques account for the increase in trading. Nonsense. There's only one way a mania develops. It is driven by persistently higher prices. And in a mania, prices are easily influenced by mechanical forces and frauds. Sentiment eventually becomes a one way street. SENTIMENT Technical Analysis is all about interpreting sentiment. Sentiment drives price and it drives volume. Sentiment is the ultimate distillation of supply and demand. BUT sentiment has been evolved significantly by the mania. At a recent family reunion, I spoke with Michael, an engaging 23-year-old who had become a day trader. He was trading upwards of a million shares per day of Intel. Just Intel. He had recently traded three million shares in one day! By his own admission, he knows nothing about the economy, nor Intel, and simply hopes to ram through a penny of profit at a time, in and out every few seconds of every trading day. Sentiment for Michael is simply the spur of the moment. Are there several hundreds just like him? Think about the math. 300 day traders like Michael? A million shares per day? 300 million shares? So just what portion of daily volume has to do with "real" investing? What portion has to do with players who use no analysis at all, just a gut feel of a one-stock market, a penny at a time, ten seconds at a time? Can we possibly determine what portion of transactional volume actually depends upon corporate prospects any more? Does sentiment drive Michael to buy or sell? Or is it more like the flow of electrons that nudges him one way or the other? How easy is it for Michael to be swayed in one direction or another? In his book, the Psychology of the Stock Market, David Dreman describes an experiment that demonstrates the "pressures of compliance." Each subject was asked to pick which of three lines on a card was the same size as a single line on a second card. Dreman wrote, "The lines were of such disparate lengths that there should have been no difficulty in immediately choosing the one of the proper length." Of eight people who participated in each group, seven were confederates and one an actual subject. As the experiment progressed, the confederates would go from indicating the correct line to calling out wrong answers. The pressures of group opinion increased the rate of error tenfold as subjects simply "went along" and also responded incorrectly, whether they thought the group was right or wrong! The natural and human response is to remain a part of the community. Exclusion from the community equates to being "wrong." Thus, "compliance" is a strong element in our behavior. Did the same "pressure of compliance" coerce Michael and other day traders into doubling Intel's price from last fall? J. Doyne Farmer, of the Santa Fe Institute in New Mexico, has presented a theoretical model that assumes traders place orders at random rather than on the basis of calculation and observation of economic trends. The model nevertheless reproduces the statistical features and characteristics of financial markets. Modern economics recognizes that traders are not fully informed or rational. How do they cope with imperfect information? Their behavior is interdependent and sometimes irrational and leads to herding, otherwise known as the "pressures of compliance." Have the same "pressures of compliance" coerced active managers to lower cash-to-assets ratios of mutual funds? Emphatically, yes! GREENPAN "PUT" Much of the "pressures of compliance" that are visible today have to do with what has become widely known as the "Greenspan Put." Can we deny that the Federal Reserve comprehends just how important the stock market has become? Can anyone fight against a central bank policy that is designed to promote stocks as an asset class? Of course, this is another controversial subject and none of us would like to admit that the market can be manipulated in any way, shape or form.....but it can....and it is. Consider Tuesday, October 20, 1987. The stock market had crashed the day before. Specialists opened the Dow 11.5% higher on Tuesday morning. The gains faded rapidly as self preservation took over and specialists sold. There is no stronger emotion in the marketplace than self preservation. The downside accelerated and fears rose that another crash was possible. Prices fell below Monday's close of 1738 until 12:30 pm, when the Dow printed as low as 1708. All options had ceased trading. All futures other than the XMI Major Market Index had ceased trading. At the time, I remember wondering how the illiquid XMI contract could remain open while the vastly more liquid S&P pit needed to be closed. Then quite suddenly, the XMI exploded. Within five minutes, the December futures contract rose from a deep discount to a huge premium, a swing equal to 24% of the Dow's value. The arbitrage window opened and program traders roared in to take advantage by buying stocks. The crash had ended. The mysterious rally was triggered by only 808 contracts. Eyewitness reports later claimed that the ring was completely deserted as liquidity dried up, then ONE MAN entered the pit and bid for everything he could buy at 12:30 pm. The man just as suddenly disappeared. The person that saved the market has never stepped forward to claim our thanks, let alone his 15 minutes of fame, and has never been identified! Perhaps the Plunge Protection Team really does exist? Certainly, the Federal Reserve has already told us on several occasions that they possess the tools to adjust the markets to their particular reality and that they will use these tools if necessary. Remember, stocks are the biggest business there is. If stocks suffer, the economy suffers. And so, we have the Greenspan "Put." And with it, we have an environment that promotes optimism and denigrates pessimism. This environment is necessarily accompanied by the "pressures of compliance" on all levels, from day traders to newsletter writers to strategists and to the public. The nature of sentiment is metamorphosing. INDEXING How does this impact TA? If Technical Analysis requires interpreting sentiment, how does TA measure the "pressures of compliance" or the influence of mechanical factors? Could it be that TA might not work or might work less effectively in such an environment? Could there actually be threats to our craft? Yes, there might. The most emphatic threat to TA is indexing, an idea that belongs on the garbage heap along with portfolio insurance. It's called "passive investing," and is part of modern portfolio theory. MPT works on the principle that the stock market is efficient because all possible information is already priced into stocks. Hence, one can only beat the market by taking greater-than-market risks. Thus, the best course of action is to simply BUY THE ENTIRE MARKET. Ironically, the Nobel Prize winners who gave us the theory now feel the S&P 500 is no longer the perfect benchmark. What is disturbing is how their sentiments have simply shifted to wider benchmarks, such as the Wilshire 5000. What is even more disturbing is how many have now been taken in by a theory that cannot possibly work, to the point that better than one in every ten dollars invested in the U.S. is now indexed to one or another benchmark - a trend that is now in place worldwide. What is the problem with indexing? Suppose there were only three stocks to invest in. Letís further suppose company A's valuation is twice B's and is triple C's. Since the index is capitalization weighted, a brand new index fund formed with $6 million would need to buy $3 million worth of stock A, $2 million worth of stock B and only $1 million worth of stock C. And as new money rolls in, half must go into stock A, one-third into stock B and one-sixth into stock C PERFORCE. Over time, stock A's prospects might deteriorate and stock C's prospects might improve and the two capitalizations might tend to converge - BUT at any particular point in time, large must necessarily equate to even larger. With each new index fund that is formed and with each new dollar invested in indexing, stock A MUST receive more sponsorship in the form of an artificial demand, a demand that exists only because of the company's present capitalization relative to other constituents and having nothing at all to do with the company's prospects. Furthermore, as indexing grows, so does the tendency of indexing to beat active money management. Ironically, the reason for this development is that money is blindly thrown at the largest stocks regardless of prospects. In essence, active money management is punished for making rational and intelligent choices.
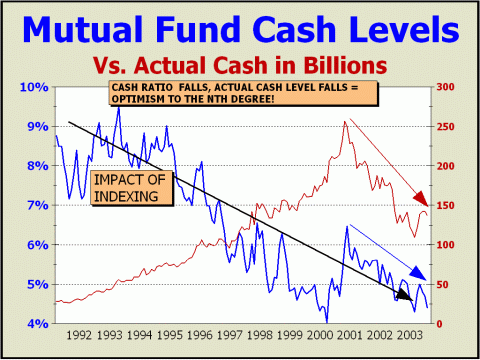
The fund manager who believes a conservative route is best cannot afford his own opinion. Index funds are always fully invested. If prices are rising, any fund with cash reserves must choose better performing stocks or must under perform the index. If an active manager carries a cash reserve equal to 5% of assets and the market rises 15%, he will lose on average, 75 basis points to an index fund. 75 basis points of under performance can mean oneís job. This is the principal reason why the cash-to-assets ratio has declined significantly since indexing began taking a huge hold on investors' assets. This is why the cash-to-assets ratio continued to decline even as prices were declining into the March 2003 low. It was one thing when the cash ratio bottomed at the end of 1999 and the beginning of 2000 as prices soared. You could see some sentiment at work then. It was quite another thing when the ratio bottomed in February 2003, coincident with the bottom in price. Since when is a major market bottom associated with a low point in the level of cash reserves?! Since indexing, when active managers realize they cannot compete otherwise. Sentiment has been corrupted by the mania. Incredibly, as the index performs even better versus active managers because more money is thrown at it, still MORE money is thrown at it. Indexing has become a cycle of moronic simplicity. The technology of economics has given the world the perfect answer to the decision making process. There is now no need for decisions and therefore, there is no human error. After the crash in 1987, Professor Joseph Wiezenbaum of MIT concluded that "People tend to rely on technology to escape the burden of acting as independent agent." We saw this conclusion operating in real life as portfolio insurance "protected" investor assets in 1987. The result, as technology did the thinking instead of human beings, was a stock market crash. The Professor's conclusion has surfaced again as fiduciaries have elected to separate themselves from the decision making process. They have wrongly accepted the easy route, that the market cannot be beaten and thus, believe they have escaped the burden of being wrong. However, when "average" market performance is championed, no one wins. As the mania shifted into high gear and Nasdaq was touted as the "stock market for the next hundred years," perhaps S&P feared for their franchise and felt compelled to compete by including stocks like JDS Uniphase and Yahoo. Ironic, isn't it? Although indexing supposedly represents passive management, in reality, the index IS actively managed by a "selection committee." Although JDSU had "as reported" losses in each of the four prior quarters, the stock was included in the index and an artificial demand for the shares was created. At its peak valuation, JDSU was one of the largest companies in the country, worth as much as $225 billion. Selection criteria have far less to do with corporate prospects than we would care to admit. In July 2002, the selection committee announced the dumping of seven foreign issues in favor of seven domestic companies in order to align the index as a pure US play. The seven new constituents arrived with a collective 67.5 P/E and 0.26% yield. Amazingly, the impetus was that the move would provide buying power for US stocks as the additions were a smaller total market cap than those leaving. As explained by David Blitzer, the chairman of S.& P.'s index committee, "This is a net buy. When the dust settles, the index funds will buy a little bit more of the other 493 companies." However, the presumption of billions more invested in the other S&P constituents necessarily meant billions more invested with zero regard to corporate prospects. The 30 largest stock losses after the bubble burst amounted to $3.8 trillion in market cap, as the group fell more than 72%. So much for the efficiency of the stock market and MPT. If the theory were correct, such relative overvaluations could not have been possible and declines of this magnitude could not have occurred. Now that the focus is shifting towards wider benchmarks such as the Russell 3000 and Wilshire 5000, the problem worsens since the new proxies are also capitalization weighted. The same inefficiencies are present! The top 25 stocks still account for an enormous share of each index; 41% of the S&P, 35% of the Russell and 33% of the Wilshire. If indexing continues to grow, more money will be thrown at stocks regardless of their prospects, and more money will be thrown at the largest issues, no matter how potentially overvalued. The efficient market hypothesis is bunk. Information is nowhere nearly priced into stocks. Enron at $70 and Worldcom at $60 were perfect proof. And since the only way to beat indexing is to take larger risks, this is precisely what you see happening today. This is why Nasdaq is up 50% from the bottom. It's not corporate prospects that drives the price of these stocks - it is the survival instincts of the active managers who buy them! It is - in every single aspect of what David Dreman wrote about - the "pressures of compliance." And here's the punch line. Picture two markets. One totally without indexing. Stocks trade based solely on their prospects. Technicians gauge these prospects with their analysis of sentiment, of supply and demand. Picture another market that is totally indexed. No one buys on the basis of prospects. Stocks are only bought in proportion to their capitalization. If sentiment for company prospects is not an issue, how can one analyze supply and demand? How can TA function in such an environment? In scientific terms, we could call indexing ENTROPY.
Entropy is defined as the degradation of the matter and energy in the universe
to an ultimate state of inert uniformity. The more indexing is utilized,
the less meaning sentiment has in determining price. Eventually,
price has nothing to do with sentiment.
PROGRAM TRADING Another threat to TA is program trading. Programs are defined as orders for the purchase or sale of at least 15 different stocks with a total value of $1 million or more. This includes but is not limited to stock-index arbitrage.
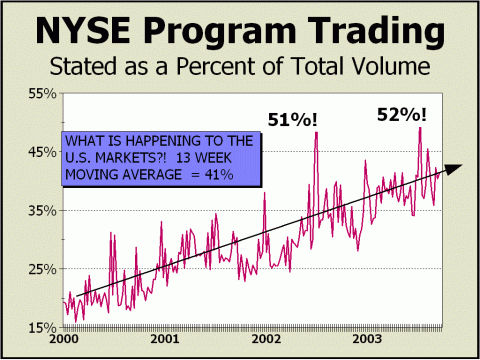
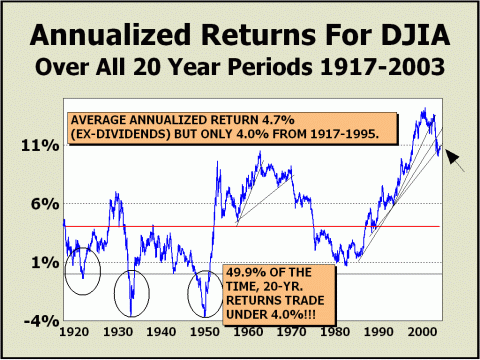
In just a few years, programs have expanded from a small fraction to more than 41% of all volume on the New York Exchange. Because of the "pressures of compliance," the chances are increasingly likely that programs take place because of an indexer or because of an active manager competing with indexing. Additionally, some institutions are now selling the benefits of packaged programs to hedge funds that are buying puts and calls and immediately taking the other side of the trades by selling and buying stocks. One colleague who has been offered such programs has privately confided to me, "None of this trading has anything to do with where the market is going or what the economy is doing." It is no wonder that frauds have been perpetrated upon investors. The individual investor is simply disappearing as a factor in the stock market and has become an all too easy mark. This is an environment where sentiment can lose its meaning entirely. EXTRAPOLATING THE FUTURE The U. S. stock market has metamorphosed into something quite grotesque. Since stocks have become such an important business and are so essential to the survival of our economy, the Federal Reserve must endeavor to keep the wealth status quo and must accommodate investors. Investors know this and are emboldened to take risks. Thus, the nature of sentiment has changed so markedly that one's best course would be to impart a positive bias to whatever techniques they use. The situation is exacerbated by active money managers in their quest to compete with index funds. In order to compete, they buy riskier issues. In order to compete, cash reserves are spent down and represent an additional source of demand having not to do with sentiment, but survival. Ironic and amazing - the strongest emotion is self preservation. Look how that has changed - from selling stock to establish high cash reserves to buying more stock to accomplish lower cash reserves. Sentiments are now corrupt. How does TA cope with the threats posed by corrupted sentiments? By evolving, along with the mania. My own preference is to use "extrapolation." Extrapolation techniques can be predictive because one extrapolates possible trends to construct an image of the future - this is otherwise known as "inductive logic." My last charts today will provide an example of an extrapolation technique. First, let's examine a chart of 20-year annualized returns for the Dow Industrials.
The picture you see is ex-dividends. The Dow has returned only 4.7% annualized over all rolling 20-year periods. This is even with the benefit of survival bias. Over the life of this chart, the Dow's selection committee has excised the garbage and added new superstars on a total of 29 separate occasions. Yet remove the mania years of 1995 to the present day and 20-year annualized returns fall to only 4%. Even if you keep the manic returns in, over the 86 years shown, 20-year annualized returns have been under 4% fully half the time. Question. I need a show of hands. How many of you believe we are in a bull market? How many of you believe we are in a cyclical bull market within a secular bear market? How many of you believe the correct answer is neither - that we are STILL immersed in the greatest stock market mania of all time? [ED NOTE: THE MAJORITY OF THE
AUDIENCE "VOTED" FOR A BULL MARKET,
If you're in the bull market group, you are certainly not looking for the Dow to trade below the October 2002 lows. If you're in the secular bear group, you're not completely sure. Like the period from 1966 to 1982, you might think we have already suffered the equivalent of the 1974 low and stocks will simply remain in a wide trading range until the next secular bull market arrives. However, if you believe we're still in a mania, then you're dead certain that the answer is that the Dow will eventually take out the October 2002 lows.
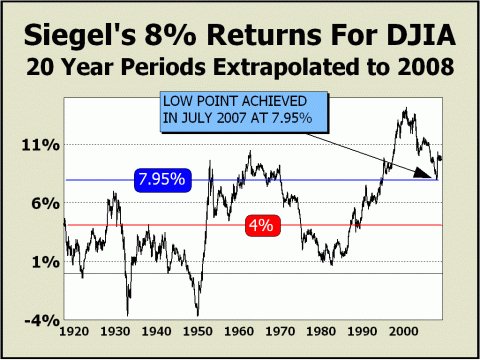
Using extrapolation techniques, we can see why. First, let's use Professor Jeremy Siegel's bullish views as a guide. Siegel claims that stocks should have a real return of 4%-5%, translating into nominal returns of 7%-9% a year. Using Siegel's mid-point of 8%, our next chart takes us to Dow 13,685 without suffering even one week on the downside. The absolute low point for 20-year annualized returns falls in July 2007 at 7.95%. Spectacular, if you ask me. Over the life of the chart, a 7.95% or better return for rolling 20-year periods is in view less than 26% of the time. Can we fairly extrapolate returns that are still so unlikely from a historical perspective? Worse yet, if you consider the 77-year history before June 1994, the last time 20-year annualized returns traded under 7.95%, returns above 7.95% occurred only 12% of the time. The mania has done an astonishing job of convincing participants that returns will be permanently high.
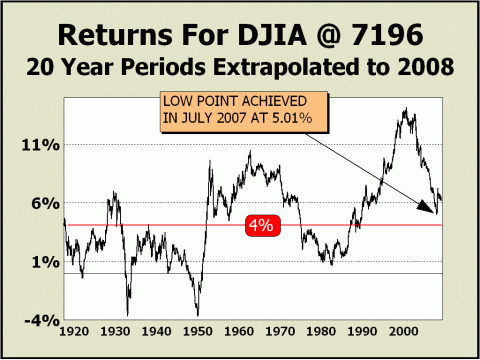
All I have done in our final chart is to plug in a 7196 number for the Dow for each week over the next five years - this is one point below the Dow's print low achieved on October 10, 2002. As you can easily see, the low point in the next five years is achieved in July 2007 at a 20-year annualized return of 5.01% - this is still well above the historical average. The argument for using extrapolation techniques; although stocks do not always follow a predictable course for 20-year returns over the short term, they must offer some predictive value over the long term since there are competing asset classes. For most of us, the choice is either stocks or bonds, although commodities and real estate are clearly alternatives. Stocks cannot possibly continue to earn returns approaching 8%. If they did, there would eventually be no reason for anyone with a long term horizon to ever buy bonds yielding less. But if no one is going to buy corporate bonds, corporations would have to sell more stock. And if corporations issued more stock, that would water down everyone else's holding, lowering overall returns. And what about governments? In order to compete - governments would have to offer much higher coupons and yields. Once they were able to compete, investors would then have the choice to buy bonds instead of stocks, and thus lower the returns for stocks. One way or another, the two asset classes must co-exist or one must die. To co-exist, they must compete. The odds appear to indicate that Dow 7196 or much worse is somewhere in our future. Using extrapolation techniques like this might clear the way for asset allocators to make changes they might not otherwise consider. CONCLUSIONS The stock market has metamorphosed before our eyes. We live in a unique period, driven by the biggest industry the world has ever known. An industry that is now driven by many purely mechanical factors. These factors have aided the corruption of sentiment, not only allowing a mania to emerge but maintaining the mania. The Fed has also impacted sentiment by maintaining the "Greenspan Put." If price is a function of supply and demand, and the supply/demand equation has been impacted by mechanical factors and corrupted sentiment, what is the future for TA, which attempts to predict prices via the analysis of sentiment? Technical Analysis MUST evolve. Extrapolation techniques are one methodology that should be worth examining. These techniques should work - with imaginative perspectives - on all time frames.
Although the above speech was prepared for an audience of technical analysts, the primary objective was to provide proof that the metamorphosis of the U.S. stock market threatens all participants, not just the methodology of technical analysts. This writer feels the U.S. capital markets have changed so significantly that inertia alone may be able to provide a continuation to the mania. Of course, prices cannot rise forever and March 2000 was the prefect example of how rapidly and emphatically excesses can be unwound. Regarding the point that the momentum or inertia of the market can continue, witness how overt and excessive bullishness has yet to end the rally.
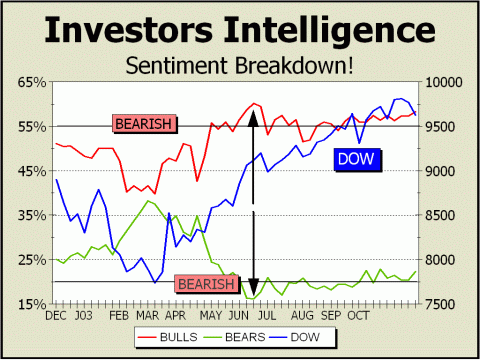
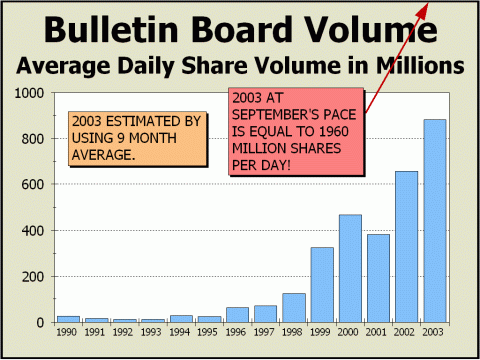
On June 18, 2003, the Investor's Intelligence reading for newsletter writers showed 60.2% bulls and only 16.1% bears, a ratio of 3.7 bulls for every bear and the most one-sided survey since shortly before the Dow peaked in 1987. We do not have to remind you of the consequences that suddenly appeared in October 1987. Contrarian stances typically work and they work well! But in a mania, we have learned that just about anything can (and will) happen. Although bulls and bears have both consistently remained at levels that in normal times would be a clarion call for a significant price correction, nothing of the sort has occurred. In fact, as of this writing the Dow has tacked on another 8.3% and the Nasdaq Composite has gained an additional 21.6%! NOTE: THE TWO LINES ARE CORRECTLY LABELED. WHEN BULLS ARE AS HIGH AS THE TOP "BEARISH" LINE AND/OR BEARS ARE AS LOW AS THE BOTTOM "BEARISH" LINE, SENTIMENT IS DECIDEDLY NEGATIVE. We believe this is the first time in stock market history that such a one-sided sentiment reading has not catalyzed a price correction. And without any doubt, this is also the longest period in stock market history that bullish sentiment has prevailed to this degree. Just how bullish are investors and speculators? Probably a LOT more bullish than they were at the top in March 2000. How do we come up with that assumption? Easy. In the last seven months, net inflows into stock mutual funds have totaled over $134 billion, even while the stock market has suffered some of its worst scandals, including the managements of the very mutual fund companies to which investors were sending their money! Of course, some of the inflows are being funneled in via corporate and government pension managers who believe there is no place else they can invest. Despite valuations that they must recognize are historically "off the charts," they are nevertheless, content to buy stocks at quite literally any price. In the case of indexed dollars, the money is thrown at many stocks regardless of their prospects, regardless of how insanely valued the company's shares may be and of course, this only makes the shares even more expensive and thus, larger components requiring even more index dollars! This is a cycle of unbelievable stupidity and atrocious judgment is being shown by any and all managers who are tied to any cap weighted index. Lest we forget about speculators, they have gone completely off the deep end and are generating activity as never before, well beyond even the manic peak in March 2000. Bear in mind that Nasdaq's Bulletin Board is comprised of the riskiest issues, an arena where listing requirements are nearly non-existent; in the words found on the Investor Information page of the OTCBB site, "There are no minimum quantitative standards which must be met by an issuer for its securities to be quoted on the OTCBB (bold italics ours)." NO minimum quantitative standards yet trading is off the wall in a blowoff that is likely to be twice the level achieved in the manic year of 2000!
Finally, we must admit that we are most heavily influenced by persons whose wisdom and experience far outweighs our own. Warren Buffett, 73, Richard Russell, 79, Seth Glickenhaus, 88, and Sir John Templeton, 92, have all made their fortunes by buying stock. They have completely sworn off the current environment. In the cases of Buffett and Glickenhaus, they cannot find anything worthy of purchase. In the case of Russell, he foresees a massive bear market still ahead. In the case of Sir John Templeton, he sees the market as "broken," [CLICK HERE FOR ARTICLE] an assessment we clearly agree with, and perhaps an even better appellation than "metamorphosis" for a market that is no longer recognizable from the one we grew up with. Could they all be so wrong.....?
Intermediate Term Targets: Dow 8500 /// SPX 900 /// Nasdaq Composite 1540-1630 Our upside targets
have all been exceeded
Long Term Targets for the bear market - odds now favor October 2004: Dow 6400 /// SPX 680 /// Nasdaq 1000-1100 THE CONTENTS OF THE ENTIRE WEBSITE ARE COPYRIGHT 2003 ALAN M. NEWMAN I hope you have enjoyed your visit and please return again. If you know anyone who might be interested in seeing what we have to offer, we'd be happy to have them visit as well! Alan M. Newman, December 2, 2003 All information on this website is prepared from data obtained from sources believed reliable, but not guaranteed by us, and is not considered to be all inclusive. Any stocks, sectors or indexes mentioned on this page are not to be construed as buy, sell, hold or short recommendations. This report is for informational and entertainment purposes only. Longboat Global Advisors, Alan M. Newman and or a member of Mr. Newmanís family may be long or short the securities or related options or other derivative securities mentioned in this report. Our perspectives are subject to change without notice. We assume no responsibility or liability for the information contained in this report. No investment or trading advice whatsoever is implied by our commentary, coverage or charts. |
